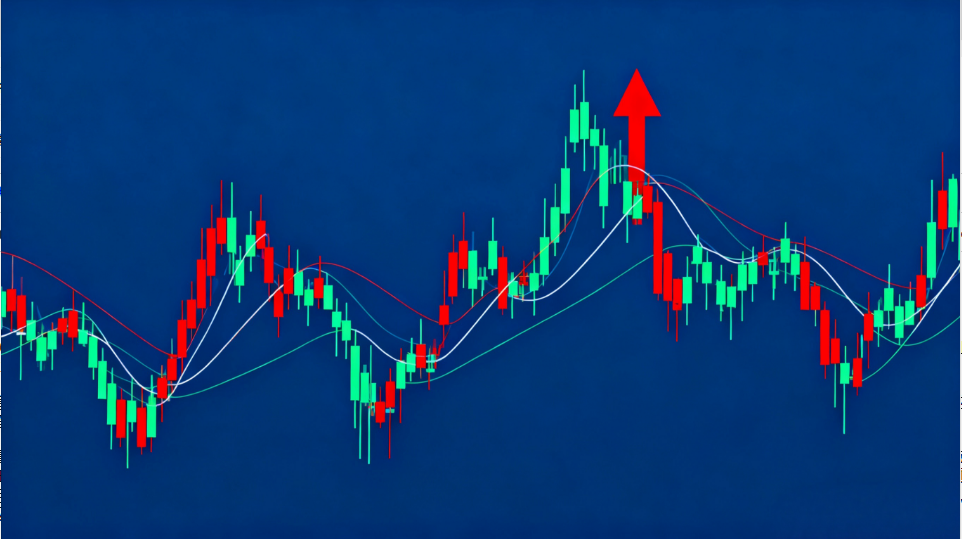
How to Identify Profit Effect and Loss Effect
—Buy at the Start of Profit Effect, Sell Before Loss Effect Begins
Profit Effect
-
Number of Limit-up Stocks
A key metric for short-term traders. Over 60 limit-ups indicate strong profit effect; below 60 signals weakening momentum. -
Consecutive Limit-up Stocks
High success rate in consecutive limit-ups reflects profitable momentum trading, boosting overall market sentiment. -
Highest Space Plate
The stock with the most consecutive limit-ups (e.g., 6) sets the benchmark. Its failure suppresses others; its success ignites rallies. -
Yesterday's Limit-up Performance
If most limit-up stocks fall the next day (negative data), avoid chasing highs—profit effect is collapsing. -
Maximum Intraday Profit ("Earth to Sky")
A stock rising 20%~40% in one day is rare but electrifying. Analyze its logic—it may spur broader rallies.
Loss Effect
-
Number of Limit-down Stocks
Over 10 limit-downs signal severe loss effect. Note: Even 10 limit-downs hurt more than 60 limit-ups help. -
Failed Limit-up Rate
High failure rate means momentum traders are losing, crushing short-term sentiment. -
Maximum Intraday Loss ("Sky to Earth")
A stock dropping 20%~40% in one day often triggers chain reactions. Exit immediately.
Key Rules:
-
Buy Signals: >60 limit-ups, rising consecutive limit-up rate, space plate breakout, "earth to sky" stocks.
-
Sell Signals: >10 limit-downs, rising failed limit-up rate, multiple "sky to earth" stocks.


