


What is the Merrill Lynch Investment Clock?
In the investment world, there is a widely discussed and applied theory known as the Merrill Lynch Investment Clock. It serves not only as a compass for financial markets but also as a crystallization of investors' insights into economic cycles. So, what exactly is the Merrill Lynch Investment Clock, and what are its applications?
What is the Merrill Lynch Investment Clock?
The Merrill Lynch Investment Clock, also called the Investment Clock, originated from a research report published by Merrill Lynch in 2004. The report meticulously analyzed U.S. economic cycles from 1973 to 2004, conducting in-depth retrospective studies on the returns of major asset classes across different economic phases. It revealed the best-performing assets in each cycle and their rotational patterns.
Beyond asset classes, the report also compared specific industries and market sectors. Ultimately, it presented a clock-like diagram that intuitively integrated economic cycles, asset rotation, and sector rotation, offering investors a clear strategy for asset allocation in different economic environments.
Economic Cycles and Asset Allocation
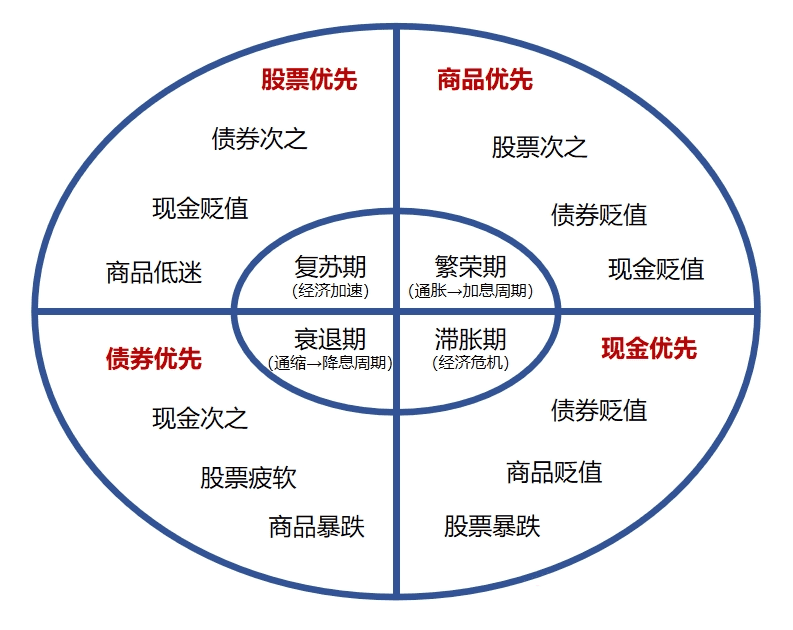
The Merrill Lynch Investment Clock divides the economic cycle into four phases: recession, recovery, boom, and stagflation. The cycle starts with recession and moves clockwise through recovery, boom, and stagflation. In each phase, different assets—bonds, stocks, commodities, and cash—tend to outperform.
1. Recession
-
Macroeconomic downturn, weakened corporate profitability, widening output gap, falling commodity prices, oversupply, and declining inflation (increasing purchasing power of money).
-
Central banks may implement loose monetary policies (e.g., rate cuts), benefiting the bond market (lower rates increase bond prices).
2. Recovery
-
Loose policies take effect—businesses improve, profits grow, the economy rebounds, and demand rises but does not exceed supply.
-
Monetary policy remains stable, inflation rises (cash loses purchasing power).
-
Investors favor stocks due to improving corporate earnings.
3. Boom
-
Demand exceeds supply, production bottlenecks emerge, commodity prices rise, and inflation pressures build (holding cash becomes costly).
-
Central banks may tighten policies (e.g., rate hikes), hurting bonds.
-
Commodities become the top-performing asset.
4. Stagflation
-
Economic growth slows, but inflation remains high—central banks hesitate to ease, leading to short-term bond market weakness.
-
Poor corporate earnings drag down stock prices.
-
With bonds, commodities, and stocks underperforming, cash or money market funds become a safer choice.
Limitations of the Merrill Lynch Investment Clock
While the Investment Clock provides a robust analytical framework, it has limitations:
-
Economic transitions are not always clear-cut and can be influenced by policy changes or market sentiment.
-
When economic cycles weaken or stabilize, the model’s accuracy declines.


