What Are Japanese Candlestick Charts (Forex K-Line Charts) Used in Forex Trading?
Forex is a highly complex field, and traders need to understand various economic concepts and methods. Japanese candlestick charting is one such essential knowledge for forex traders. Most people unfamiliar with forex, especially beginners, do not understand what Japanese candlestick charting is.
Introduction to Japanese Candlesticks:
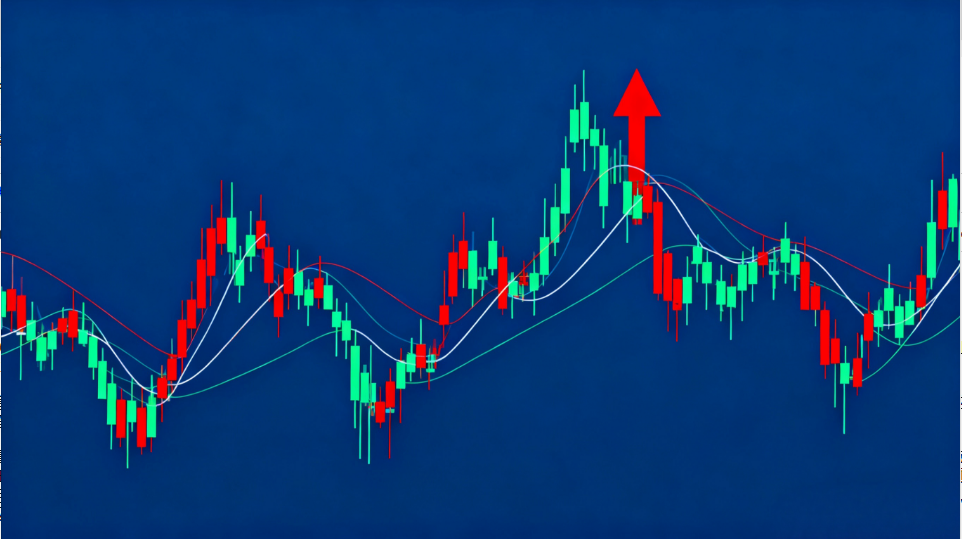
Simply put, candlestick lines, also known as K-lines, are a charting method where different trend patterns are formed by a series of candlesticks. These patterns are analyzed to derive data, which is then used to predict market movements.
How to Read Japanese Candlestick Charts:
-
The thin line at the top of the K-line is called the upper shadow (wick), the middle rectangular block is the body, and the thin line at the bottom is the lower shadow (wick).
-
When the closing price is higher than the opening price (indicating an upward trend), the body is displayed as hollow or red.
-
In this case, the length of the upper shadow represents the difference between the highest price and the closing price, the body’s length shows the difference between the closing and opening prices, and the lower shadow reflects the difference between the opening and lowest prices.
Recommended Book:
-
Title: Japanese Candlestick Charting Techniques
-
Author: Steve Nison
-
Publication Date: July 1, 2003
-
Summary: This book provides comprehensive content, using numerous high-quality chart examples to explain and analyze Japanese candlestick techniques in detail. Its engaging and fluid writing makes it suitable for beginners to learn the basics and for experienced investors to conduct in-depth research.
Conclusion:
Today, Japanese candlestick charting is widely used as a key method for analyzing futures, forex, and other markets. Interested traders can benefit from learning this analytical technique, as it significantly aids in predicting forex market trends.


