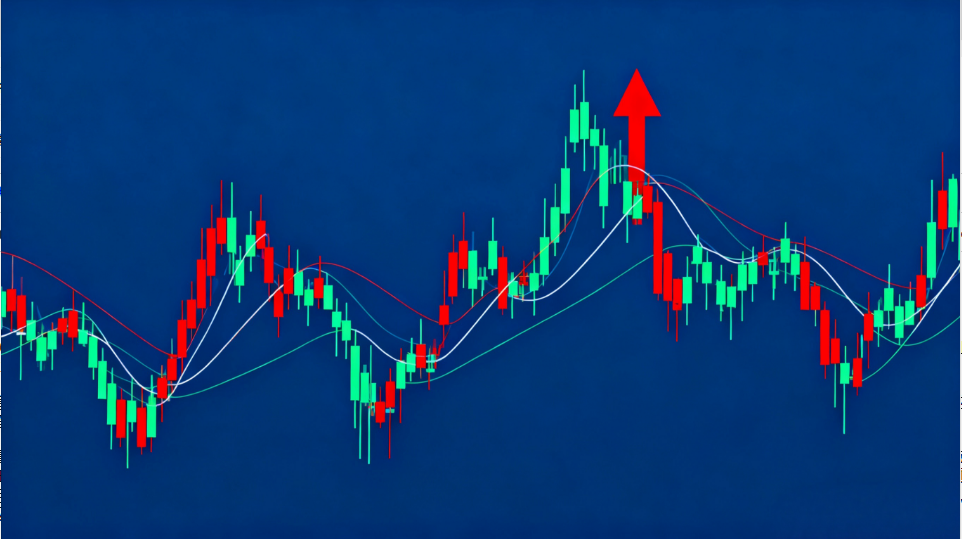
The founder of Wave Theory is Ralph Nelson Elliott. In 1934, Elliott established contact with Collins, an editor of a stock market newsletter, and subsequently began his career on Wall Street, publishing the book *Wave Theory*. However, it was not until the late 1970s when Prechter popularized Wave Theory and achieved remarkable results in actual trading competitions that it began to gain attention in the field of securities analysis.
Wave Theory is a set of rules derived entirely from observation, used to analyze stock market indices and price trends. It is also the most widely used yet most difficult to understand and master analytical tool in global stock market analysis.
Elliott believed that fluctuations in stock or commodity prices, like natural tides and waves, follow one after another in a cyclical pattern with a considerable degree of regularity, exhibiting periodic characteristics. Any fluctuation leaves traces, allowing investors to predict future price movements based on these patterns and make appropriate trading strategy choices.
The two most basic forms of price fluctuations are **impulse waves** and **corrective waves**. An impulse wave can be subdivided into five smaller waves, typically labeled as Wave 1, Wave 2, Wave 3, Wave 4, and Wave 5. A corrective wave can be divided into three smaller waves, usually labeled as Wave A, Wave B, and Wave C. After these eight waves are completed, one cycle concludes, and the trend enters the next eight-wave cycle.
Theoretically, when the market is rising, a complete eight-wave cycle consists of five upward waves and three downward waves. Conversely, if the market is consistently declining, the complete eight-wave cycle consists of five downward waves and three upward waves. In practical analysis, since stock indices generally trend upward, the five-up-three-down structure is commonly adopted.
**(I) Impulse Waves**
An impulse wave (i.e., a wave moving in the same direction as the overall market trend) can be further divided into five smaller waves, labeled as Wave 1, Wave 2, Wave 3, Wave 4, and Wave 5.
1. **Wave 1**
Most Wave 1s are part of forming a bottom pattern, marking the beginning of the eight-wave cycle. Since this upward movement occurs as a rebound or reversal after a downtrend in a bear market, buying power is not strong, and selling pressure from bears persists. As a result, when Wave 2 corrects after Wave 1, the retracement is often deep. Alternatively, some Wave 1s appear after prolonged consolidation, resulting in a larger upward movement.
Empirically, Wave 1 is usually the shortest among the five waves.
2. **Wave 2**
This is a downward wave. Since investors mistakenly believe the bear market is not over, the correction is often significant, nearly erasing Wave 1's gains. When prices approach the bottom (Wave 1's starting point), a reluctance to sell emerges, selling pressure diminishes, and trading volume shrinks, signaling the end of Wave 2.
This wave often features chart reversal patterns like head-and-shoulders bottoms, double bottoms, etc.
3. **Wave 3**
Wave 3 is typically the strongest and most explosive upward wave, also called the "extended wave." It often lasts the longest, with restored investor confidence and surging trading volume. Traditional chart breakout signals, such as gap-ups, frequently appear. Resistance levels are easily broken, especially when Wave 1's high is surpassed, marking a strong buy signal. Due to its intensity, Wave 3 often exhibits extensions.
4. **Wave 4**
As frenzied buying weakens, Wave 3 enters a stagnation phase, and profit-taking spreads. Investors who bought at lows cash out to secure gains, triggering another price drop. Wave 4 is a corrective wave after a sharp rise, often complex, featuring diagonal triangles. However, Wave 4's bottom does not fall below Wave 1's peak.
5. **Wave 5**
In Wave 5, second- and third-tier stocks usually dominate, outperforming blue-chips ("rising tide lifts all boats"). Market sentiment is overly optimistic. In stocks, Wave 5's rise is often weaker than Wave 3 and may fail. When momentum fades, the market enters the next phase.
**(II) Corrective Waves**
1. **Wave A**
Most investors view Wave A as a temporary pullback, not a trend reversal. However, warning signs (e.g., volume-price divergence) often appear in Wave 5. Due to lingering optimism, Wave A may show flat or zigzag corrections.
2. **Wave B**
Wave B often has low volume and is a "bull trap," luring investors into thinking a new uptrend has begun. Many get trapped here.
3. **Wave C**
Wave C is a destructive decline—sharp, deep, prolonged, and broad-based.
**(III) Extensions**
Extensions can occur in Waves 1, 3, or 5 (rarely in two). Typically, they appear in Wave 5, sometimes even extending further, making Wave Theory contentious and hard to apply.
**(IV) Fractals**
Each upward or downward movement contains smaller eight-wave cycles—"waves within waves."
**(V) Key Principles**
1. A full cycle has eight waves (5 up, 3 down).
2. Waves can merge into higher-degree waves or split into smaller ones.
3. Impulse waves subdivide into five smaller waves.
4. Among Waves 1, 3, and 5, Wave 3 cannot be the shortest.
5. If one impulse wave extends, the others tend toward equality in time and magnitude.
6. Corrective waves usually unfold in three waves.
7. Wave 4 must not overlap Wave 1's peak.
8. Wave Theory comprises pattern, ratio, and time (in order of importance).
9. It reflects mass psychology—accuracy improves with market participation.
**(VI) Limitations**
Like Dow Theory, Wave Theory has flaws:
1. **Subjectivity:** Analysts often disagree on wave counts.
2. **Ambiguity:** No clear rules define a "complete wave." Markets rarely follow the rigid 5-3 model, yet theorists exclude "non-conforming" moves.
3. **Practical Difficulty:** Post-hoc analysis is easier, but real-time wave identification is complex due to fractals and extensions. It also offers no stock-picking guidance.


