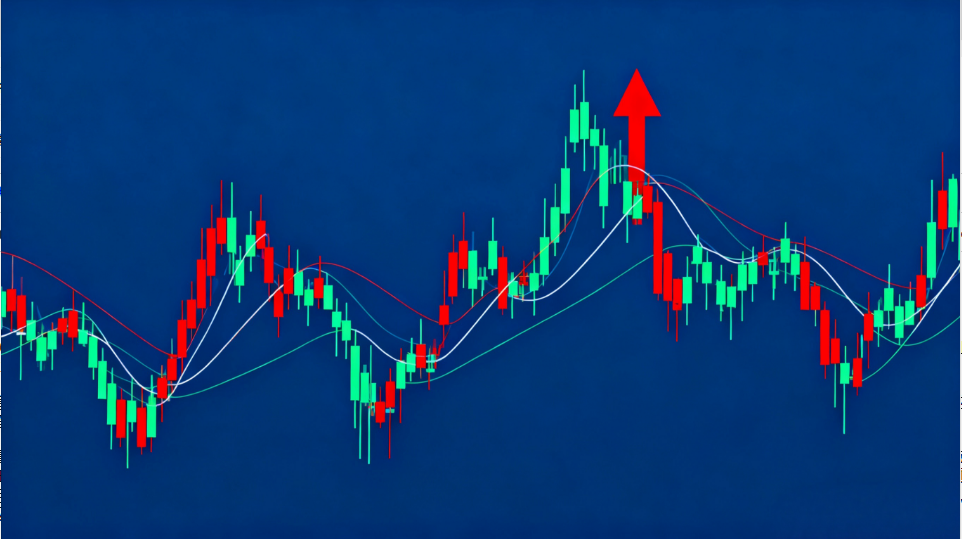
What is Divergence? A Detailed Explanation of Divergence-Related Knowledge
What is Divergence?
Divergence, also known as "deviation," occurs when a stock or index continuously makes new lows (or highs) during a downtrend or uptrend, but certain technical indicators fail to follow suit.
During divergence, the upward or downward momentum slows down, and the price trend is likely to reverse. Bottom divergence occurs when the stock price or index is at a relatively low level, while top divergence is the opposite.
Types of Divergence
-
Top Divergence
Top divergence indicates that the upward momentum is weakening, and the index or stock price struggles to sustain its highs, potentially leading to a reversal. Investors should consider selling early when this occurs. -
Bottom Divergence
Bottom divergence suggests that the downtrend is nearing its end, and the index or stock price is bottoming out and rebounding, serving as a buy signal.
Analyzing Divergence
Judging divergence based solely on price movements is difficult. Investors should use technical indicators (e.g., RSI, KDJ), trading volume, and open interest for confirmation.
For example, using the RSI (Relative Strength Index):
-
If the stock price hits a new high, surpassing the previous peak, but the RSI is lower than the prior peak or even falls below 50 (the neutral line), this confirms top divergence.
-
Conversely, if the stock price drops below the previous low, but the RSI does not follow and instead rises above the prior low, this indicates bottom divergence.
Divergence can appear in hourly, daily, or weekly charts. However, short-term charts (e.g., 15-minute or 5-minute) are more prone to false signals due to high volatility, whereas daily and weekly charts provide more reliable divergence signals.
Moreover, the more frequent the divergence, the higher the likelihood of a trend reversal. Generally, if divergence occurs three or more times, the probability of a top or bottom formation is significantly higher.


