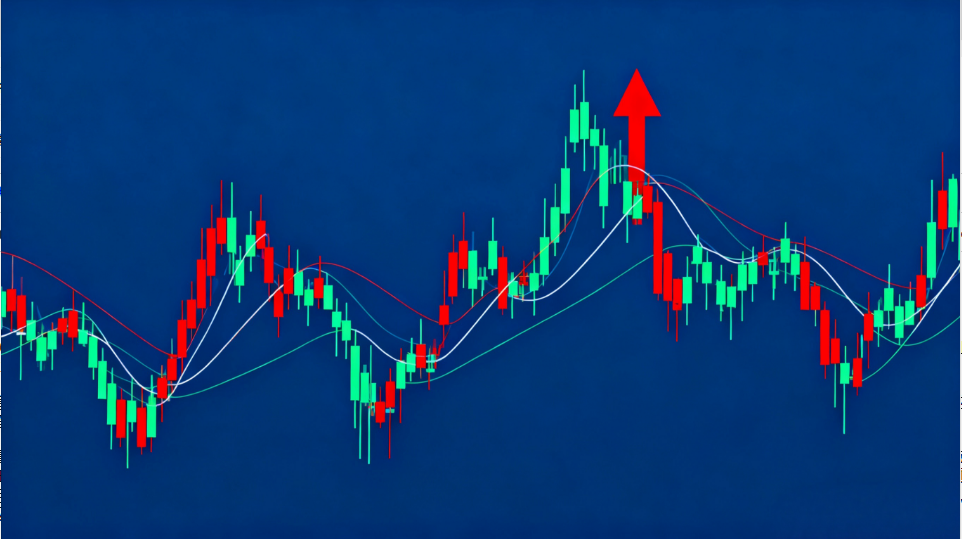
Dow Theory first points out that stock market trends can be divided into long-term, intermediate, and short-term trends. The characteristics of these trends are as follows:
1. Long-term Trends
Dow Theory uses the analogy of tides to describe stock market trends. The long-term trend is like the rising or falling tide. During a rising tide, the water level continuously increases. Each time the tide washes ashore, it reaches higher than before. Though the tide is constantly moving—advancing, receding slightly, then advancing again—each subsequent surge progresses further inland. Over time, the rising tide eventually covers a large area of the shore.
Similarly, the stock market experiences "rising tides." During such periods, the market consistently climbs higher, though with occasional minor pullbacks. After each pullback, the market surges forward again, with stock indices reaching new highs. In a long-term bull market, like a rising tide, both the overall market index and individual stock prices continuously advance.
A falling tide operates in the opposite manner. As the tide recedes, each wave retreats further from the shore, gradually exposing more of the beach. However, the retreat is not instantaneous—it occurs gradually, with waves still occasionally surging forward before ultimately receding further.
In the stock market, a long-term bear trend resembles this ebbing tide. Prices decline overall, with occasional minor rebounds, but each subsequent drop reaches lower levels. Both market indices and individual stock prices progressively decrease.
2. Intermediate Trends
The long-term trend can be compared to the tide's overall movement. A long-term bull market is like an incoming tide—despite temporary retreats between waves, each new wave reaches higher. Conversely, in a long-term bear market, each wave falls short of the previous one, gradually receding further from the shore.
Intermediate trends represent the fluctuations within the long-term trend. During a rising tide, the water advances overall, but not in a straight line—it periodically pulls back before surging higher again. These temporary retreats within the broader advance constitute intermediate trends. Similarly, in the stock market, after a significant rally, there are often short-term pullbacks—these are intermediate downtrends within the larger uptrend.
During a falling tide (bear market), the pattern reverses. The tide gradually recedes, with occasional smaller waves still pushing forward before continuing their retreat. In the stock market, this manifests as temporary rallies within a broader decline—each rebound being part of the larger downward intermediate trend.
Dow Theory describes intermediate trends as "waves" within the larger "tide" of the long-term trend. These waves represent the medium-term fluctuations that occur within the primary market direction.
3. Short-term Trends
Using the tidal analogy, the long-term trend is the tide itself, while intermediate trends are the larger waves. Short-term trends, then, are like ripples on the water's surface—daily or even intraday price movements that have minimal impact on the broader trend.
These ripples may occasionally move contrary to the primary trend. For example, even in a long-term uptrend, there might be a few days of sharp decline. Similarly, during a bear market, short-lived rallies may occur. These fluctuations don't alter the intermediate or long-term trends, much like ripples don't change the tide's direction.
Dow Theory identifies these three trends—long-term (tides), intermediate (waves), and short-term (ripples)—as the fundamental components of market movement. Mastering the ability to distinguish between them is key to understanding Dow Theory's essence.


