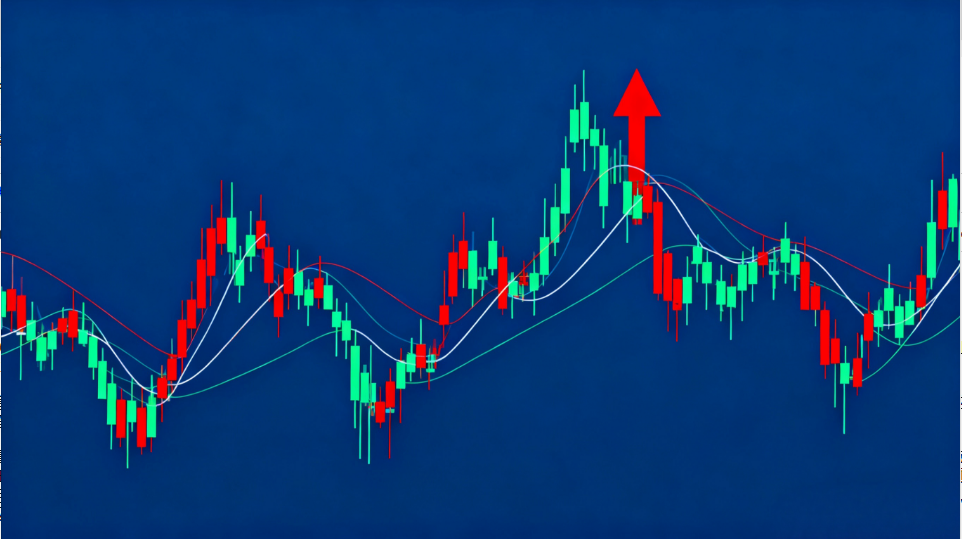
Definition and Characteristics of Double Needle Bottom, Trading Strategy
The "Double Needle Bottom" consists of two candlesticks, characterized by long lower shadows in two adjacent or nearby candlesticks, with the lowest prices being the same or close. The two long lower shadows act like probes, indicating that the stock price has essentially found its bottom.
Characteristics of Double Needle Bottom
-
The two candlesticks may be adjacent or separated by a few others, but the key feature is the presence of two long lower shadows.
-
The Double Needle Bottom pattern only appears at low levels, signaling a potential bottom.
Trading Strategy for Double Needle Bottom
-
The pattern must appear at a low level. If the decline prior to the pattern is less than 20%, caution is advised.
-
The "two needles" can be two closely connected long lower shadows or separated by a few candlesticks, but the interval should not be too long. If more than five candlesticks separate them, it may evolve into a "Double Bottom" pattern, though the trading approach remains similar.
-
After the pattern appears, the stock price usually rebounds immediately, leading to a strong upward trend. However, some stocks may briefly rally before declining again, requiring patience and potential position-averaging.
Response to Double Needle Bottom in Different Trends:
-
In an uptrend: The pattern suggests weakening bullish momentum. The first long upper shadow indicates strong resistance, and the second confirms it, signaling a possible end to the uptrend or a shift to consolidation/reversal. Heavy positions should consider profit-taking.
-
In a downtrend correction: If the pattern appears during a pullback, it suggests the correction may be complete, presenting a potential shorting opportunity.
-
In a downtrend: The pattern indicates diminishing bearish power. The first long lower shadow shows strong support, and the second confirms it, suggesting a possible trend reversal or consolidation. Short positions should consider closing profits.
-
In an uptrend correction: The pattern suggests the pullback may be ending, presenting a potential long entry opportunity. If preceded by a strong downtrend, two long lower shadow candles (e.g., doji stars) forming a Double Needle Bottom indicate exhaustion of selling pressure, often leading to a reversal.


