Technical Analysis Can Be Divided into the Following Five Categories (Part 1)
-
Indicator-Based Approach
The indicator-based approach considers various aspects of market behavior, establishes mathematical models, and derives formulas to calculate numerical values that reflect the intrinsic nature of a specific aspect of the forex market. These values are called indicator values. The specific numerical values and their interrelationships directly reflect the state of the market, providing guidance for trading decisions. Indicators often reveal insights that are not immediately visible from raw price data.
Currently, there are countless technical indicators used in forex markets worldwide—at least over a thousand. Examples include the Relative Strength Index (RSI), Stochastic Oscillator (KD), Directional Movement Index (DMI), Moving Average Convergence Divergence (MACD), On-Balance Volume (OBV), Psychological Line (PSY), and Bias Ratio (BIAS). These are well-known technical indicators that have stood the test of time in trading. Moreover, new indicators continue to emerge, enriching and expanding this vast family.
-
Trendline-Based Approach
The trendline-based approach involves drawing straight lines on forex charts using specific methods and principles, then analyzing these lines to predict future price trends. These lines are called trendlines, and their primary function is to identify support and resistance levels. The extended positions of support and resistance lines impose constraints on future price movements.
Generally, when forex prices rise from below, they tend to reverse downward upon approaching (or even before reaching) a resistance line. Similarly, during a downtrend, prices often reverse upward near support levels. If prices break through a trendline without reversing—continuing upward or downward—this is called a breakout. After a breakout, the trendline still holds significance, but its role reverses: former support becomes resistance, and former resistance becomes support. Trendline analysis relies heavily on this characteristic.
The method of drawing trendlines is crucial, as accuracy directly impacts predictive outcomes. Many established techniques exist, refined through long-term study. Well-known examples include trendlines, channel lines, as well as Fibonacci retracements, Gann lines, and angle lines. Traders have benefited greatly from applying these tools in practice.
-
Chart Pattern School
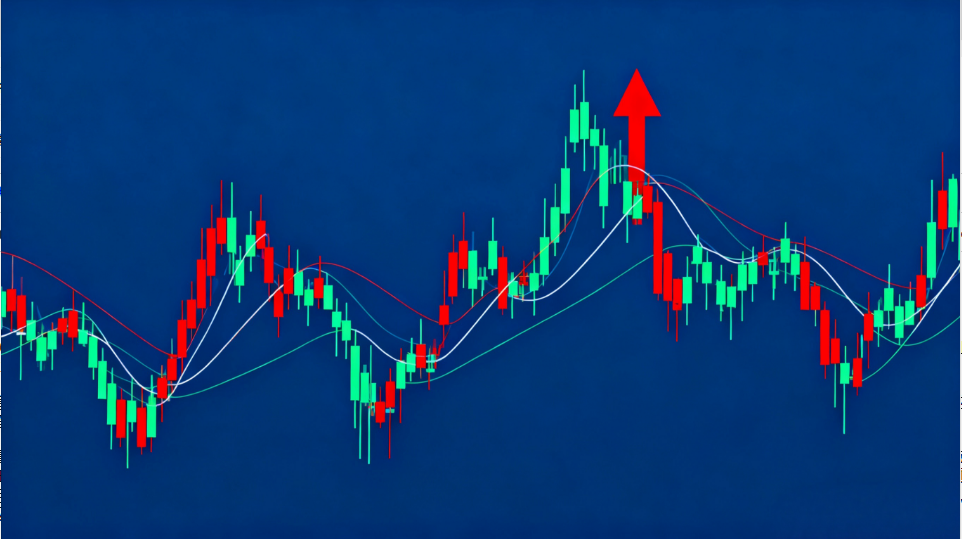
The chart pattern school predicts future forex price trends by analyzing historical price movements depicted in charts. The first axiom of technical analysis states: "Market action discounts everything." Price patterns are a critical component of market behavior, reflecting how the forex market digests information. Thus, using past price trajectories (patterns) to forecast future movements is logically sound.
By studying these patterns, traders can gauge the broader market environment and adjust their strategies accordingly. Famous patterns include double tops (M头), double bottoms (W底), head and shoulders tops/bottoms, and over a dozen others—all distilled from collective market wisdom.


