What is Volume Divergence? Precisely, it refers to "Price-Volume Divergence."
Price-volume divergence occurs when the market price reaches a new high, but trading volume decreases instead of increasing—indicating an inverse relationship between price and volume. This often signals that market participants reject the current price level, and selling pressure may soon emerge.
Such divergence reflects a shift in the price-volume dynamic compared to prior patterns, potentially heralding a new trend or merely a correction in an uptrend/rebound in a downtrend.
In bear markets, prices tend to "fall under their own weight." While investors prefer to see heightened activity during declines, volume isn't critical during downtrends. However, volume expansion is absolutely essential during bottom reversals. If prices break upward without a significant volume surge, the breakout's validity becomes questionable.
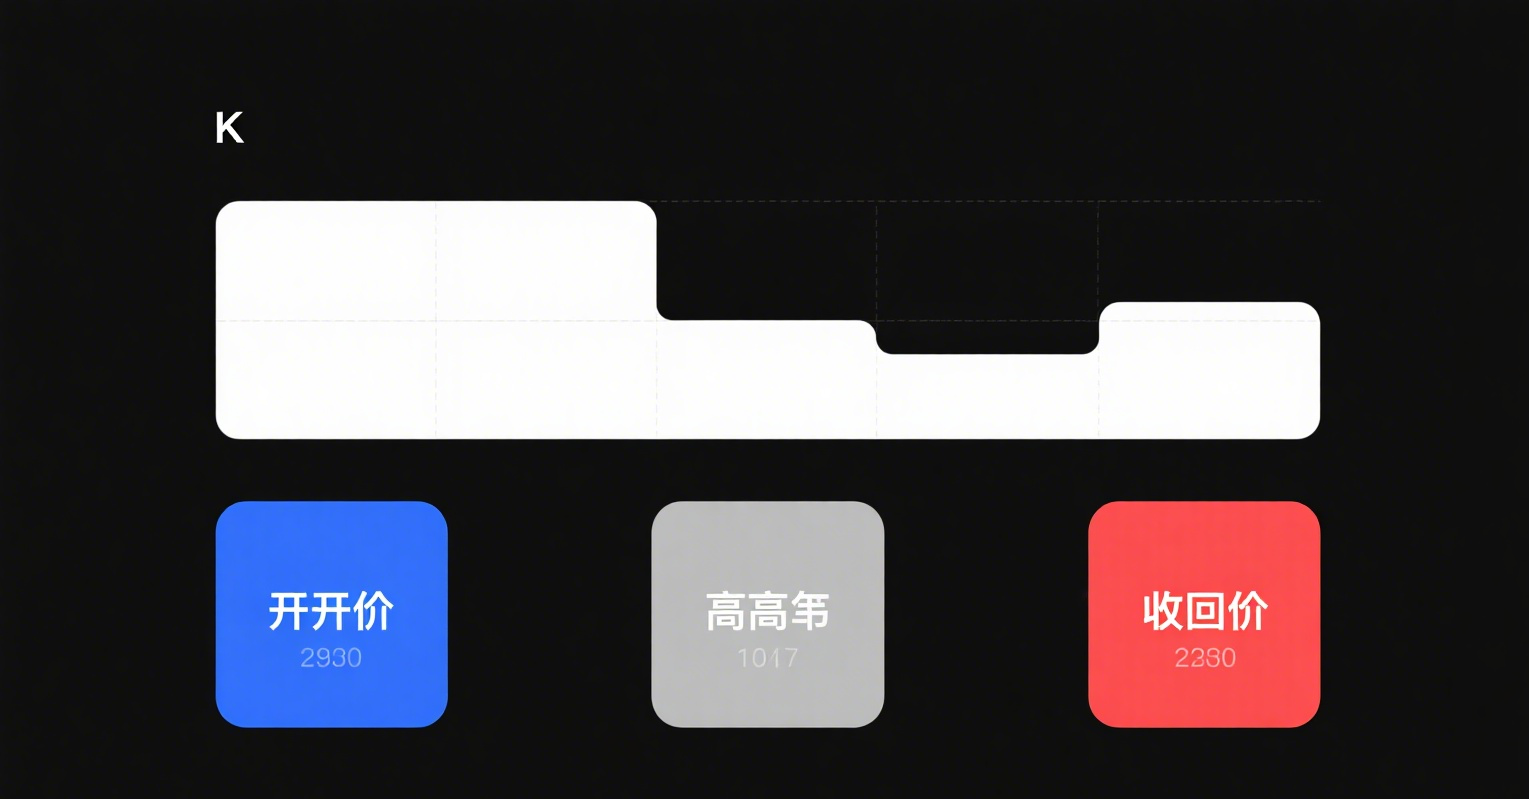
Another form is Candlestick Pattern Divergence. Take an upward breakout as an example:
-
Initial high-volume breakouts often show medium/large bullish candles, but as volume shrinks, price momentum stalls, forming dojis or small bearish/bullish candles;
-
When volume drops sharply, prices correct, producing medium bearish candles.
This creates topping patterns like "Evening Stars," "Tower Tops," or "Engulfing Bearish Lines." Traders should apply the "time-space measurement" theory, aligning short-term moves with long-term trends (e.g., minor trends submitting to major ones) for comprehensive analysis.
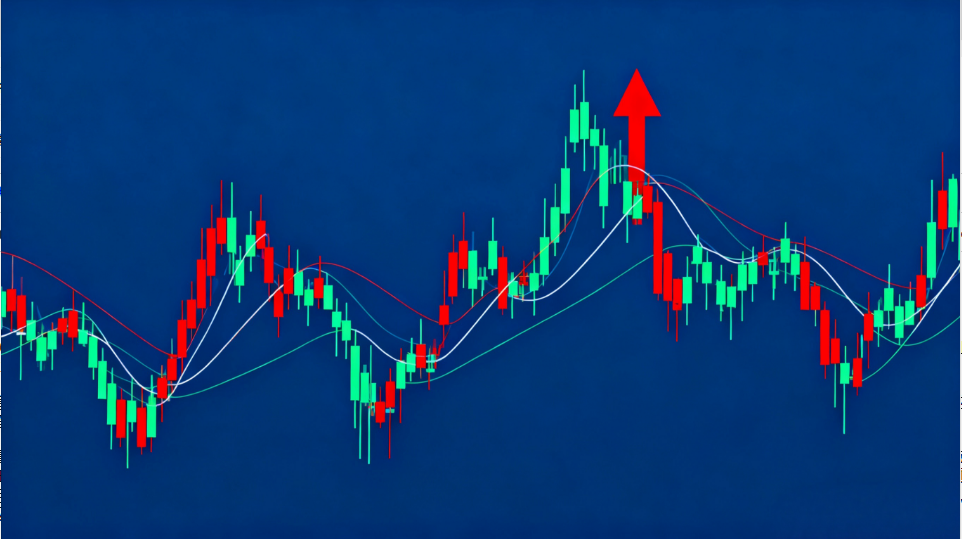
Lastly, divergence from moving averages (MAs) or other tools. For upward breakouts:
Fake breakouts often exhibit:
-
Prices hitting new highs followed by low-volume consolidation, mimicking a pullback confirmation;
-
Prices then跌破 the 5-day and 10-day MAs;
-
A "death cross" (5-day MA below 10-day MA) confirms the fakeout.
Combine multiple technical tools for cross-verification, especially watching for breakouts with prior reversal clues. First breakouts are often fake, and characteristics like absence of gaps or rapid/forceful trendline retests further expose them.


