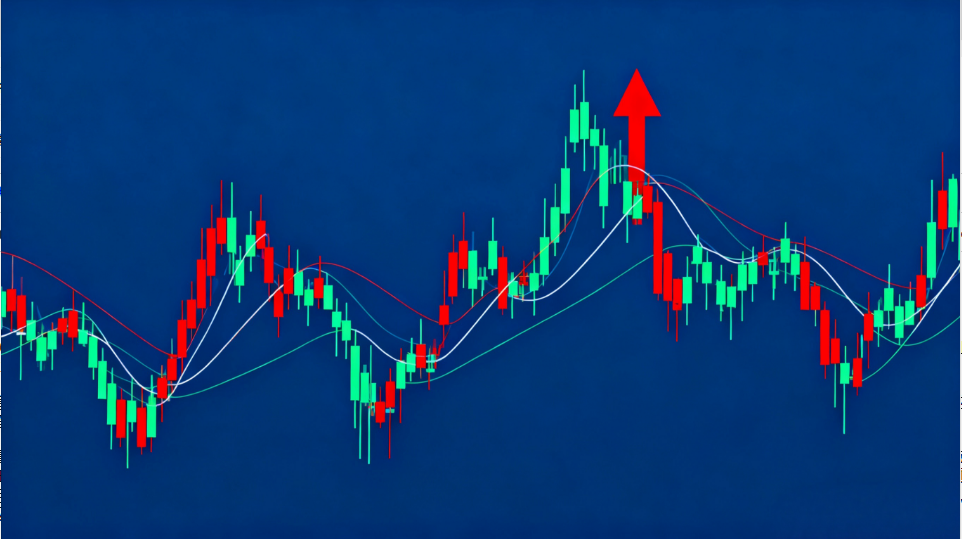
Introduction and Drawing Methods of Trendline Theory in Forex Technical Analysis
In forex technical analysis, apart from candlestick patterns, there is also the trendline theory. Like candlesticks, trendlines are widely used in forex trading. This article will introduce the basic theory of trendlines in forex technical analysis.
Basic Concept of Trendline Theory:
Trendline theory refers to the line connecting two or more low points in an uptrend and the line connecting two or more high points in a downtrend. The former is called an uptrend line, while the latter is called a downtrend line.
How to Draw Trendlines:
1. Straight Trendlines
-
A trend must be confirmed, meaning the second turning point in price must appear before drawing the line.
-
The more touchpoints a trendline has, the more valid it is. It is unnecessary to deliberately connect shadows or bodies.
-
Learn how to adjust trendlines; note that steeper trendlines tend to have shorter durations.
-
Do not fixate on the angle; pay attention to the relationship between the intervals of touchpoints and the scale of the trend.
2. Curved Trendlines (Moving Averages)
-
To discuss moving averages, one must first determine their parameters. Moving average parameters reflect market trading costs over different periods, with common settings being 10-day, 20-day, 30-day, 60-day, 120-day, and 240-day.
-
The angle of a moving average determines the strength of support/resistance. For an uptrend, a 45-degree angle is considered optimal.


