What Does Forex Technical Analysis Include?
Forex technical analysis has long been a favored method among traders, providing significant assistance in trading. So, what does forex technical analysis include?
First, we must discuss support and resistance levels. These are points on a chart that experience persistent upward or downward pressure. Support levels are typically the lowest points in any chart pattern (hourly, weekly, or yearly), while resistance levels are the highest points (peaks). When these points demonstrate recurring trends, they are identified as support and resistance.
The second component of forex technical analysis is trendlines and channels. A trendline is a simple yet practical tool for identifying market trends, formed by connecting at least two consecutive lows (with the second point higher than the first). The extension of the line helps predict the market’s movement path. A channel consists of an upward trendline parallel to a corresponding downward trendline, illustrating price movement corridors (upward, downward, or horizontal). A key feature of channels is that the connection points of the support trendline should lie between the connection points of the opposing line.
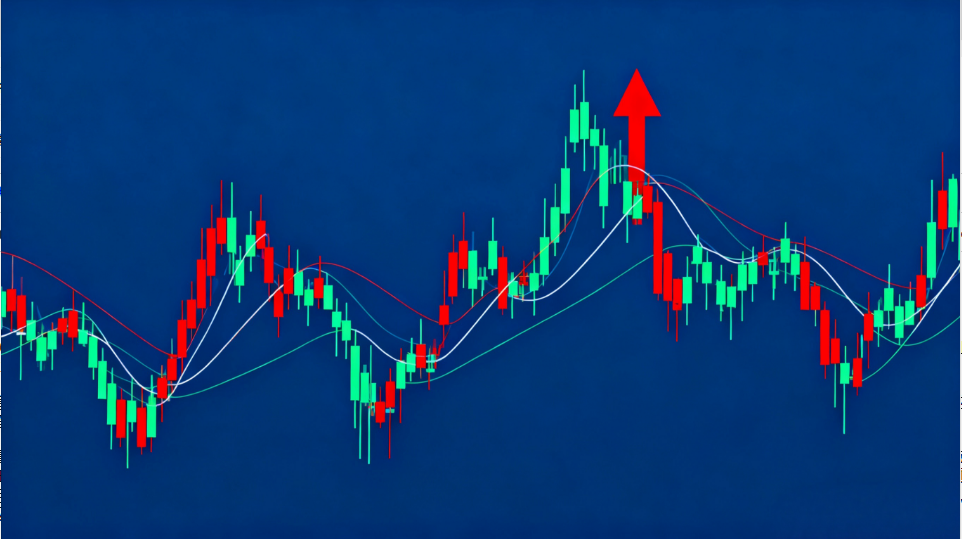
Another critical aspect is moving averages (MAs). Many forex traders frequently use MAs, which display the average price over a specific period within a given cycle. However, MAs often lag behind the market, so they cannot solely signal trend reversals. There are three types of MAs: Simple Moving Average (SMA), Linear Weighted Moving Average (LWMA), and Exponential Weighted Moving Average (EWMA).
Forex technical analysis helps traders identify trends. Recognizing the dominant trend allows traders to grasp the broader market direction and gain sharper insights. Once the overall trend is identified, traders can select entry points within their desired timeframes.


