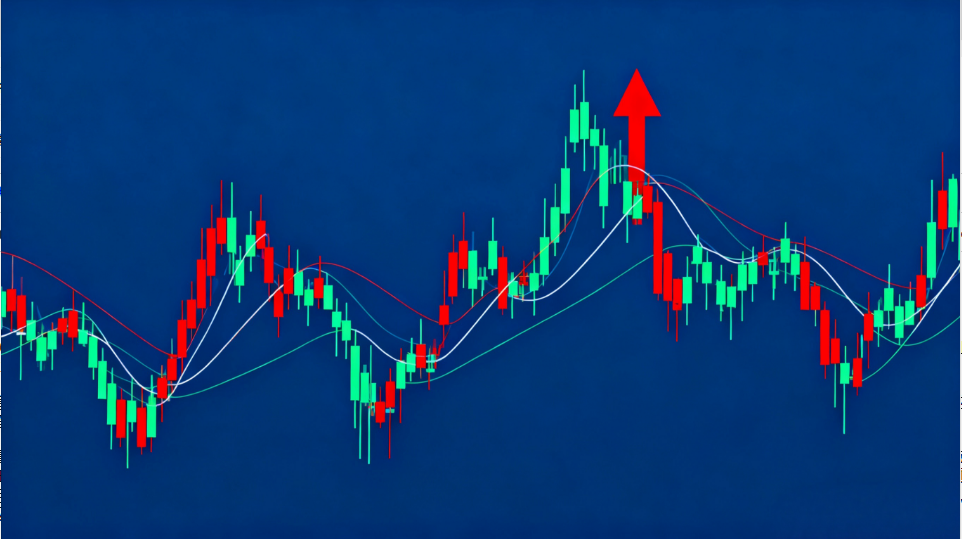
Moving Average Theory in Forex Technical Analysis
In forex technical analysis, the principle of market cost is crucial as it forms the foundation of trends. The sustainability of trends in the market is driven by the momentum of market costs. For example, in an uptrend, market costs gradually rise, while in a downtrend, market costs gradually decline. Changes in cost drive the continuation of trends.
Moving averages (MAs) reflect the average market cost changes over a specific period. I highly value moving averages and have summarized a complete set of market cost change patterns—Moving Average Theory—through years of practical experience. It is highly effective in determining major trends.
1. MA Reversion (Pullback)
MAs reflect the market cost over their respective periods. For example, the 30-day MA reflects the average market cost over 30 days. Prices always fluctuate around MAs. When prices deviate too far from MAs, cost discrepancies will cause prices to revert (pull back) toward the MA. In a bull market, this manifests as a correction during an uptrend; in a bear market, it appears as a rebound during a downtrend.
For instance, during the May 19, 1999, market surge, short-term explosive growth caused prices to deviate significantly from medium- and long-term MAs. When the index reached 1,756 points, the 30-week MA was at 1,212, and the 60-week MA was at 1,249. When prices showed extreme volatility with high volume at peak levels, it clearly signaled a market top, indicating the index would revert to the MAs.
In early 2002, when the market plunged below 1,400 points, the 30-week MA was at 1,763, and the 60-week MA was at 1,931. The deviation from MAs was substantial—over 400 points for the 30-week MA and nearly 600 points for the 60-week MA. When the market showed extreme volatility below 1,400, it signaled a market bottom and impending MA reversion. At the 1,339 bottom in early
2002, I posted two threads on the Zhongcai Forum warning traders to prepare for a rebound:
-
"Every Inch of Land, Every Drop of Blood; Every Bull, Every Soldier"—arguing that prices below 1,400 were a "graveyard for bears."
-
"I Love Low-Priced Stocks"—identifying oversold low-priced stocks as the main rebound candidates.
When the market dropped from 1,748 in July 2002 to 1,311, I sensed weakening downward momentum but misjudged the timing of the rebound. I avoided entering at 1,300+ because:
-
The 30-week (1,556) and 60-week (1,584) MAs were declining steadily (~6 points/week).
-
The deviation was only ~200 points, and resistance during the decline reduced the likelihood of a major rebound.
-
The 60-week MA (a bear market lifeline) was unlikely to break, limiting rebound potential.
-
A 200-point rebound was too small to attract big capital, offering little room for maneuver.
Had the market continued crashing below 1,200, a stronger rebound base would have formed. However, the market’s unpredictability is its charm! The limited MA deviation also suggested a technically constrained rebound.
2. MA Convergence
MA convergence signals alignment in market costs, marking critical turning points where trends may reverse.
For example:
-
Before the May 19, 1999, rally, the 5-, 10-, 30-, and 60-week MAs transitioned from divergence to convergence, signaling an impending trend shift.
-
In late August/early September 2002, MA convergence preceded a drop from 1,683 to 1,311.
The key challenge is predicting the direction of the breakout. Two principles guide this:
-
MA Obedience Principle: Short-term MAs obey long-term MAs.
-
Example (1999): The 5-, 10-, and 30-week MAs pointed down, but the 120-week MA rose strongly, leading to an upward breakout.
-
Example (2002): The 60-week MA’s downward slope overruled the 30-week MA’s rise, causing a downward breakout.
-
Daily vs. Weekly (2002): Daily MAs suggested an upward breakout, but weekly MAs indicated a drop. The market confirmed the weekly signal.
-
Limitation: MA obedience is lagging and can’t pinpoint exact tops/bottoms.
-
-
MA Reversal Principle: Violations of the obedience principle signal trend reversals, confirmed by high volume.
-
Example: In early 2002, Xiaxin Electronics (600057) reversed at ¥6 with huge volume, outperforming later.
-
Tactical Note: I chose cheaper stocks (e.g., Hua’er at ~¥4, Jiujiang Chemical Fiber at ~¥5) for short-term gains, though 600057’s long-term surge was impressive.
-
Execution Discipline:
-
Cut losses if prices fail to rebound after breaking MAs, even if the MA slope is upward (reversal signal).
Final Note: No single technical method is flawless. Combine MAs with pattern analysis, trendlines, and fundamentals for higher accuracy.


