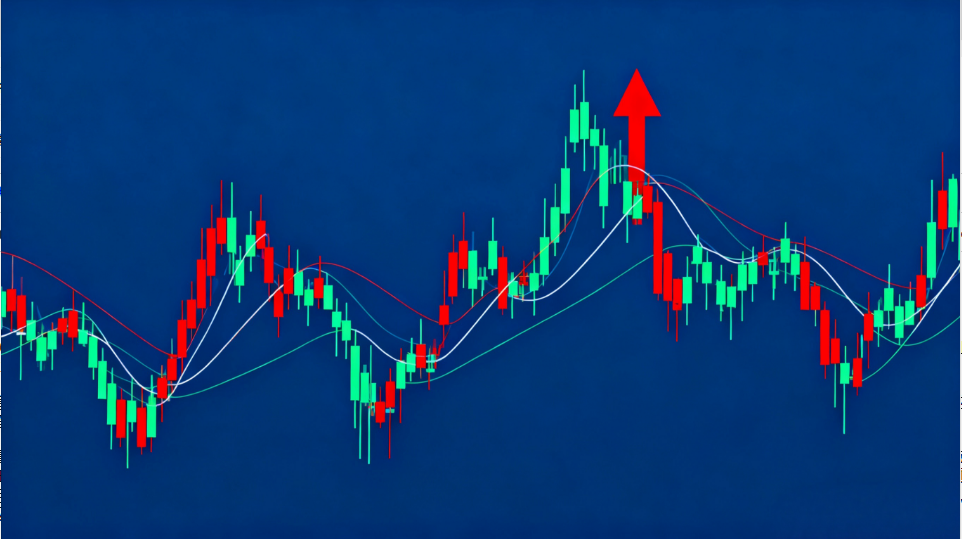
When engaging in medium- to long-term investments, investors must understand and follow the counter-cyclical theory. So, what exactly are the conclusions of this theory? And how can we provide examples to prove it? If you're interested, let’s dive into the details of counter-cyclical theory today.
To apply the counter-cyclical theory, we naturally need to review past market trends to identify clear examples. By examining the performance and valuation levels of typical cyclical industry stocks in the U.S. market over the last decade, we can derive the following conclusions about counter-cyclical theory:
**Conclusion 1:** The valuation basis for cyclical stocks is net asset value (NAV) rather than earnings per share (EPS). The volatility of the price-to-book ratio (P/B) in cyclical industries is significantly lower than that of the price-to-earnings ratio (P/E), indicating that P/B valuation is relatively stable in cyclical industries.
**Conclusion 2:** A P/B ratio not exceeding 1 is quite common in cyclical industries. Furthermore, in terms of the relationship between earnings and stock prices, stock prices tend to lead earnings indices by 6 to 12 months. This quantitative analysis shows that the application of counter-cyclical theory involves trading stocks ahead of earnings trends.
We can analyze this using the trend of international crude oil prices. First, let’s review the oil industry’s historical cycle: For most of the 20th century, U.S. industrial prices were regulated through production and price controls. After World War II, the average inflation-adjusted crude oil price (based on 2000 prices) was $19.61 per barrel, while the median domestic U.S. crude price (also adjusted to 2000 prices) was $15.25 per barrel. This means that from 1947 to 2003, oil prices exceeded $15.25 per barrel only half the time. Before March 28, 2000, when OPEC adopted a price band of $22–$28 per barrel, oil prices exceeded $22 only during wars or regional conflicts.
International oil prices began recovering in 2000, especially after the 9/11 attacks, when they surged rapidly. The OPEC basket price rose from $28 in 2003 to $51 in 2005 and surpassed $75 in 2006.
Looking at PetroChina’s H-share stock price: It opened at HKD 1.28 on April 12, 2000, and fluctuated between HKD 1–2 until 2003, peaking at HKD 2.125. The stock began rising in January 2003 and reached around HKD 9 by June 2006—a cumulative increase of nearly 8x. This timeline aligns closely with oil price trends, while its earnings only started improving in 2001.
As the complex political and economic factors driving oil prices upward gradually ease, oil prices will enter a bear market. Compared to the initial bull market starting price of $22 per barrel, it’s still too early to say oil prices have fully adjusted. According to the counter-cyclical stock-picking strategy, industries benefiting from falling crude prices may only be at the beginning of their upward trend.
That concludes our explanation of counter-cyclical theory. Investors should focus on fundamental stock selection and aim to capitalize on the entire price fluctuation cycle.


