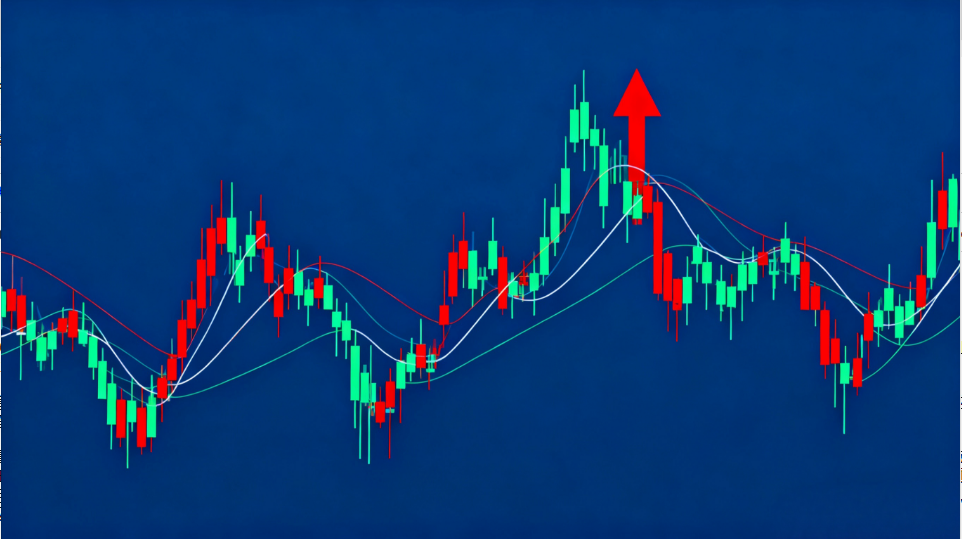
Analysis of stock index futures trading techniques involves understanding key issues, mastering trading skills, and adapting strategies to varying market conditions.
First Scenario: Trading volume decreases, open interest decreases, and prices rise. This indicates a strong wait-and-see sentiment among both bulls and bears, with reduced trading activity. The decline in open interest alongside rising prices suggests that short sellers are conceding and actively covering their positions (i.e., buying to hedge), pushing prices higher. However, new bulls are not entering the market, so the upward trend may be short-lived, followed by a likely pullback.
Second Scenario: Trading volume increases, open interest increases, and prices rise. This combination reflects active trading, with bullish (long) forces outweighing bearish (short) forces. Both sides are adding positions, but the aggressive buying by new longs chasing higher prices indicates strong optimism about future gains. This scenario suggests strong upward momentum, with prices likely to continue rising in the short term.
Third Scenario: Trading volume increases, open interest increases, and prices fall. This highlights increased positions by both bulls and bears, but bearish traders are more aggressive, selling into the downtrend. Short sellers are willing to chase lower prices because they anticipate further declines. Bulls, unwilling to concede, passively add positions at lower levels, leading to continued short-term declines. However, excessive selling may cause prices to deviate significantly from the average, attracting short-term speculators and new bulls. Combined with profit-taking by some shorts, this could trigger a V-shaped reversal.
Fourth Scenario: Trading volume increases, open interest decreases, and prices rise. This signals active stop-loss by short sellers. At market bottoms, prices rise modestly as shorts remain confident while bulls are cautious, preventing immediate rallies. At market tops, shorts urgently "flee" to cut losses, buying to cover positions, while bulls passively place stop-loss orders at higher levels without active selling pressure. This leads to sharp price spikes, indicating heavy stop-loss activity by both shorts and longs, followed by potential declines.
Fifth Scenario: Trading volume increases, open interest decreases, and prices fall. This reflects intense trading activity, but shorts are reluctant to add positions. The decline in open interest and prices suggests longs are aggressively liquidating positions, selling to cut losses. The downward momentum stems mainly from long liquidation. After a sharp drop, if open interest starts rising, it signals new longs entering the market, potentially driving a strong rebound.
Sixth Scenario: Trading volume is low, open interest decreases, and prices fall. This indicates reduced trading activity and a wait-and-see approach, with bulls actively closing positions. The low volume suggests orderly long liquidation rather than panic selling, leading to a gradual but sustained downtrend.


