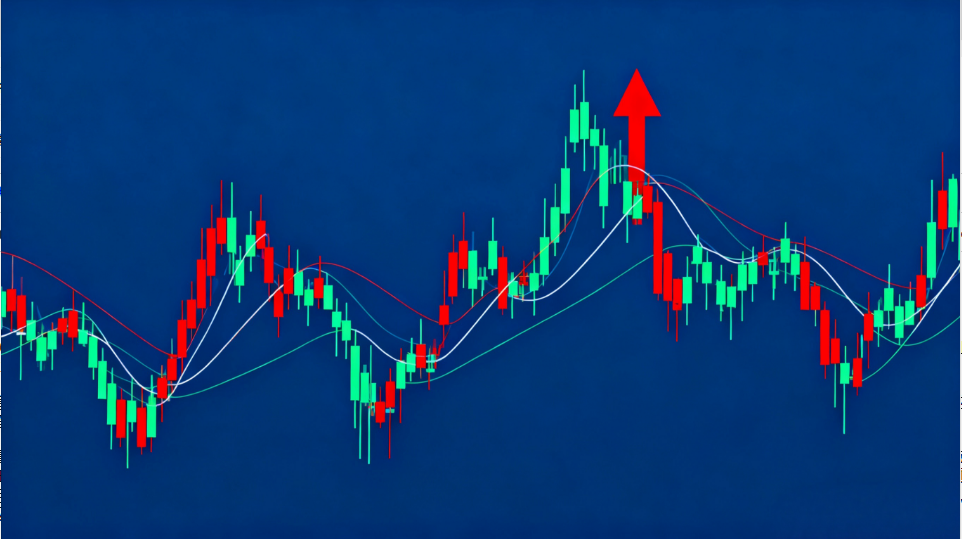
In our social circles, there are always those who are intelligent and independent, doing things their own way. At the time, we may reject their approach, but in the end, it is often these people who succeed. Sometimes, we don’t understand why those who stand against the crowd always emerge victorious. In the stock market, there is also such a group—they follow a common theory, the Contrary Theory. The spirit of "buying when others sell and selling when others buy" may represent another realm of stock investing.
Recently, some experts have analyzed this Contrary Theory. Its existence is justified, and it is widely used in stock investing, serving as an essential theory for many retail investors. It primarily relies on two indicators to maintain its rationality: the Bullish Index and the Market Sentiment Indicator (ARBR).
**What is the Bullish Index?** Simply put, it reflects bullish or bearish sentiment in the A-share market, ranging from 0 to 100. Each level carries different implications, and only through detailed analysis can one effectively apply this theory. Different ratios correspond to different strategies:
- **0% to 5%**: An upward trend is imminent. At this stage, everyone is bearish, believing the market has no hope, but when prices hit rock bottom, a reversal is near—this is the perfect time to "achieve maximum results with minimal effort."
- **5% to 20%**: A period of uncertainty. Most remain bearish, with only a few seeing potential, but this is insufficient to reverse the trend. Avoid impulsive investments; instead, analyze K-line charts and trading volume.
- **20% to 40%**: Bullish sentiment grows but still struggles against bearish forces. Caution is advised.
- **40% to 55%**: The riskiest time to act. Investors should exercise patience and avoid temptation.
Higher ratios indicate stronger bullish momentum.
The **Market Sentiment Indicator (ARBR)** reflects market enthusiasm and willingness:
- **AR (Activity Ratio)**: Measures the balance between bullish and bearish forces, using the opening price as a benchmark to compare the highest price.
- **BR (Buying Ratio)**: Gauges the outcome of the battle between bulls and bears, based on the closing price and comparing highs and lows to determine market strength.
Contrary Theory is widely applied in stock investing due to its simplicity—it only requires a combination of logic and emotional analysis. Retail investors who master this theory can significantly improve their results. As the saying goes, "Master one skill to excel," and mastering Contrary Theory can yield substantial rewards.


